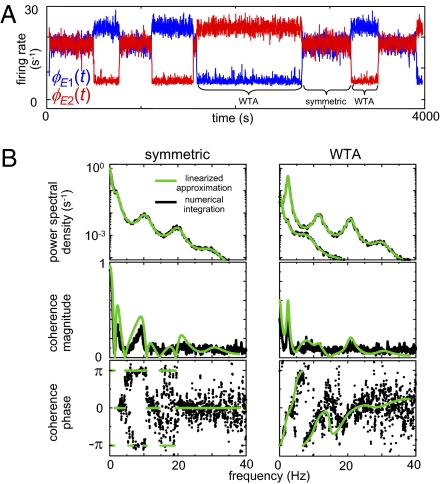
Fig. 5.
The bifurcation analysis captures the dynamical features of the population model. (A) Numerical solutions of the equations undergo the predicted abrupt transitions between modes. Blue trace,  ; red trace,
  . As predicted by the bifurcation analysis, there are abrupt transitions between a symmetric mode in which the two signals are largely synchronized and winner-take-all (WTA) modes in which one cortical region dominates the other. (B) The spectral characteristics of these modes determined by numerical integration (black) closely match those determined from the linearized equations (green). Parameters are taken from the EO state, with
  and
and  . This figure was redrawn, with permission, from Drover et al. (10), figures 4 and 5.

