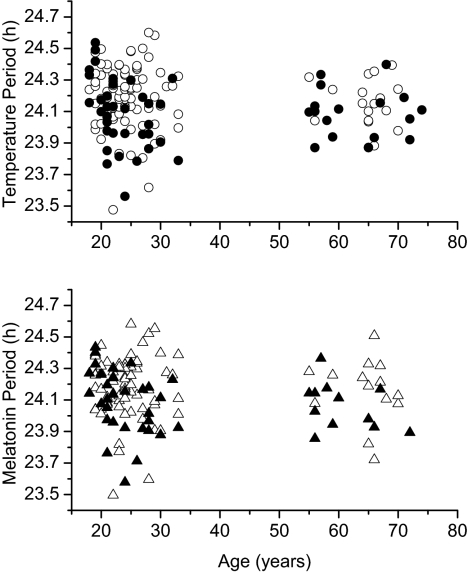
Fig. 3.
Scatter plots of temperature and melatonin periods with respect to the age of the participants. (Upper) Age (in years) vs. temperature period (in hours) for all 157 participants, with data from women in filled circles (●) and data from men in open circles (○). (Lower) Age vs. melatonin period for the subset of 129 subjects in whom melatonin data were also available, with data from women in filled triangles (▲) and data from men in open triangles (△).

