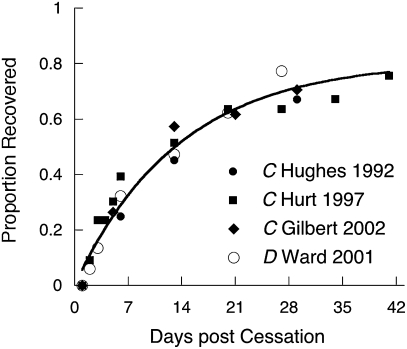
Fig. 4.
Amelioration of withdrawal symptoms in untreated or placebo groups measured on composite scales (C) (106–108) or as the simple desire to smoke (D) (109). The curve traces the predicted entry into state A for subjects who do not relapse (ρ = 0) setting β and λ at their median values from the bottom row of Table 1.

