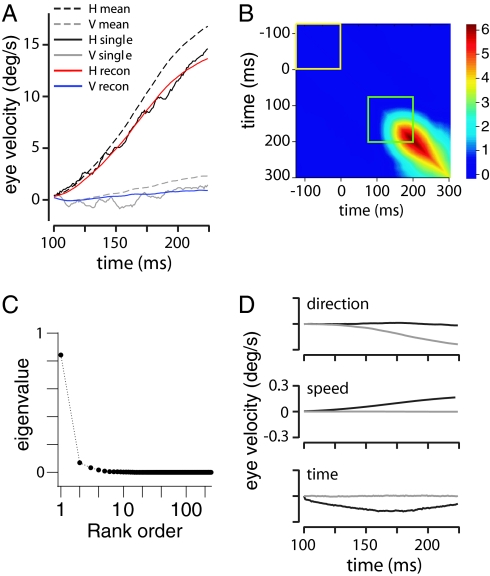
Fig. 1.
Low-dimensional dynamics of pursuit eye velocity trajectories (7). (A) Eye movements were recorded from male rhesus monkeys (Macaca mulatta) that had been trained to fixate and track visual targets. Thin black and gray lines represent horizontal (H) and vertical (V) eye velocity in response to a step in target motion on a single trial; dashed lines represent the corresponding trial-averaged means. Red and blue lines represent the model prediction. (B) Covariance matrix of the horizontal eye velocity trajectories. The yellow square marks 125 ms during the fixation period before target motion onset, the green square the first 125 ms of pursuit. The color scale is in deg/s2. (C) Eigenvalue spectrum of the difference matrix ΔC(t, t′) = Cpursuit(t, t′) (green square) − Cbackground(t, t′) (yellow square). (D) Time courses of the sensory error modes (vdir, vspeed, vtime). The sensory error modes are calculated from derivatives of the mean trajectory, as in Eq. 1, and linear combinations of these modes can be used to reconstruct trajectories on single trials as shown in A. These modes have 96% overlap with the significant dimensions that emerge from the covariance analysis in B and C and thus provide a nearly complete description of the behavioral variation. Black and gray curves correspond to H and V components.

