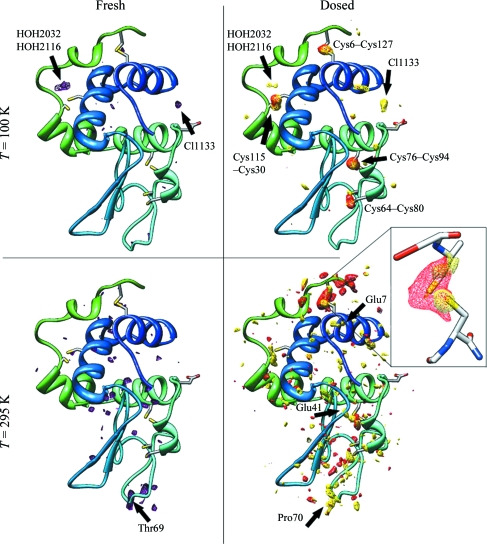
Figure 4.
Fourier difference maps comparing native tetragonal lysozyme crystals and crystals soaked in 100 mM nitrate. Top-row structures were acquired at T = 100 K and bottom-row structures at T = 295 K. Left column: difference maps (F nitrate,obs − F native,obs, ϕnative) acquired on ‘fresh’ crystals prior to delivery of a large dose. Purple contours correspond to levels of +4.4σ and +3.4σ at 100 and 295 K, respectively. At T = 100 K, two water molecules and the chloride have moved to new positions. At T = 295 K, the loop with Thr69 relocated to a new position. Right column: difference maps (F fresh,obs − F dosed,obs, ϕfresh) comparing ‘fresh’ and ‘dosed’ crystals, where damage arises from a large dose (0.12 MGy at room temperature and 1.9 MGy at T = 100 K) delivered between structural data sets. Red contours indicate damage to groups in native (nitrate-free) crystals, with levels of +4.3σ and +3.1σ at 100 and 295 K, respectively; yellow contours show damage in nitrate-soaked crystals, with levels of +4.7σ and +3.2σ at 100 and 295 K, respectively. At room temperature, the sulfur bridge Cys6–Cys127 appears to be protected by nitrate.

