
Fig. 1.
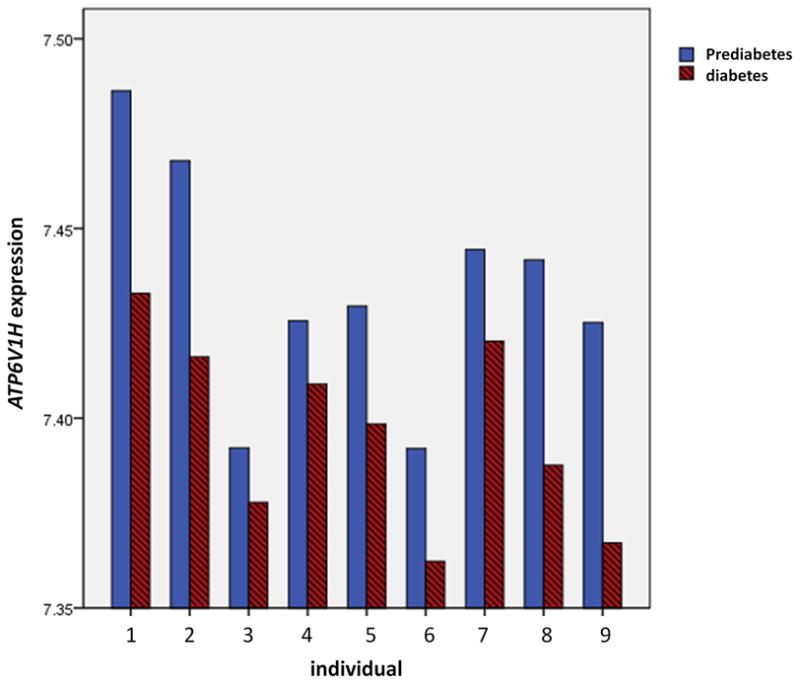
The expression of ATP6V1H in each participant. Dramatic variations were observed among the different individuals, which was concordant with our PCA finding of the whole transcriptome profiles. However, compared with pre-diabetes status, the expression of ATP6V1H in diabetes decreased in each individual without exception, with pairwise Z test P=7.18×10⁻¹¹. This observation on ATP6V1H expression highlighted the robust design of our longitudinal study.