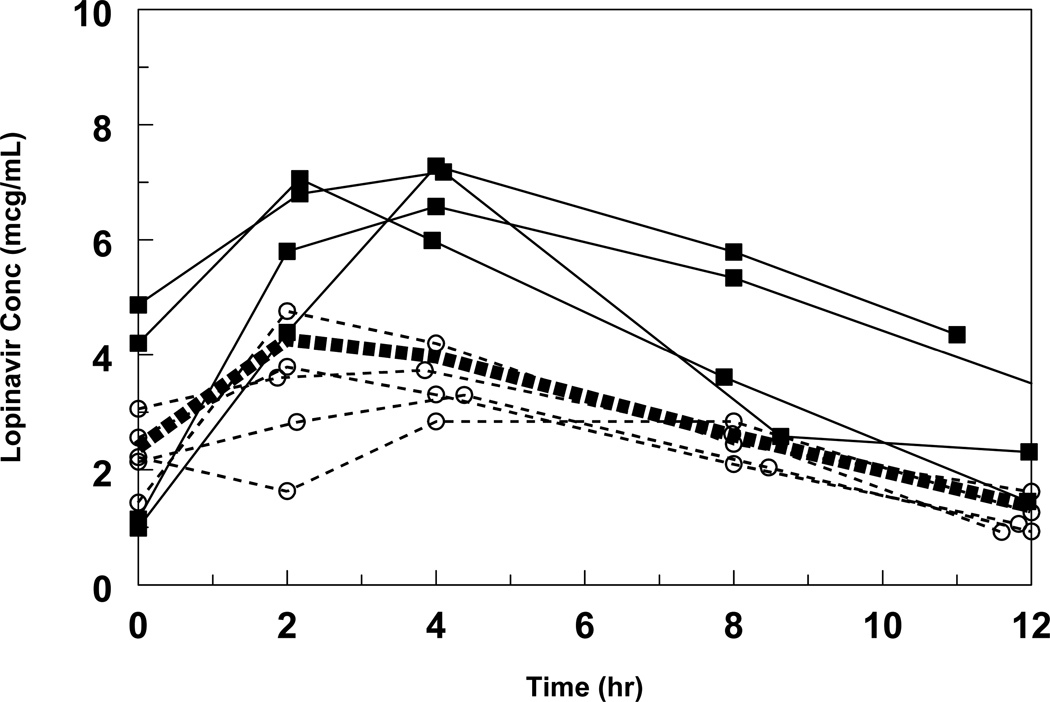
Figure 1. Individual LPV concentration time profiles.
All intensive PKs were performed at week 2 except for one performed at week 8, when adherence was assured. The bold dashed line represents the median concentration, the circles and squares represent subjects at or below and above the median, respectively.

