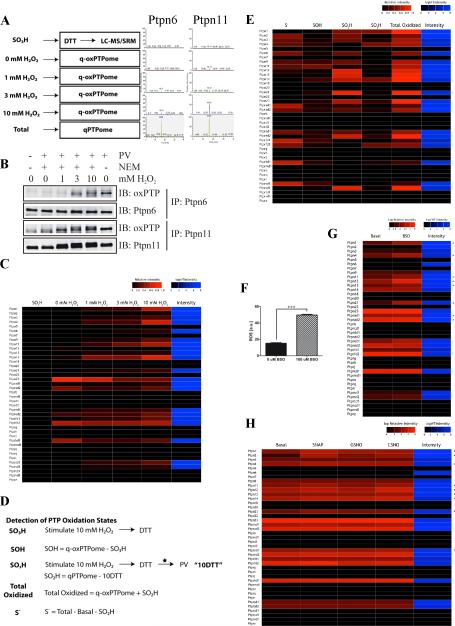
Figure 4. Monitoring multiple PTP oxidation states by q-oxPTPome.
(A) Experimental scheme (left). NIH3T3 cells were stimulated with the indicated concentrations of H2O2 for 5 min and analyzed by q-oxPTPome (n=2; 4 technical replicates each). Representative SRM profiles for Ptpn6 and Ptpn11 (right). (B) Detection of Ptpn6 and Ptpn11 oxidation. Following H2O2 stimulation, cells were processed by q-oxPTPome, immunoprecipitated with Ptpn6 or Ptpn11 antibodies and analyzed by immunoblotting, as indicated. (C) Heat map displaying levels of PTP oxidation following H2O2 stimulation, measured by q-oxPTPome. A black box indicates low levels of PTP oxidation; red boxes denote high levels. The intensity value is the average signal for the SRM profiles for each PTP measured by qPTPome. (D) Scheme showing modifications of qPTPome and q-oxPTPome to assess all potential PTP oxidation states (n=2; each with 3 technical replicates); * indicates a buffer exchange. (E) Fraction of each PTP in each potential oxidation state (i.e. S−, SOH, SO2H, SO3H) following 10 mM H2O2 stimulation. (F) ROS levels in NIH3T3 cells treated with 100 μM BSO (n=6 *** p<0.001, Student's t-test). Data represent mean ± SEM. (G) Levels of PTP oxidation in cells treated with 100 μM BSO or left untreated (n=2; 2 technical replicates each). * indicates PTPs with increased oxidation following BSO treatment. (H) Levels of nitrosylation measured by q-oxPTPome following stimulation with S-nitroso-N-penicillamine (SNAP), S-nitrosoglutathione (GSNO) or S-nitrosocysteine (CSNO). * indicates PTPs that were nitrosylated.

