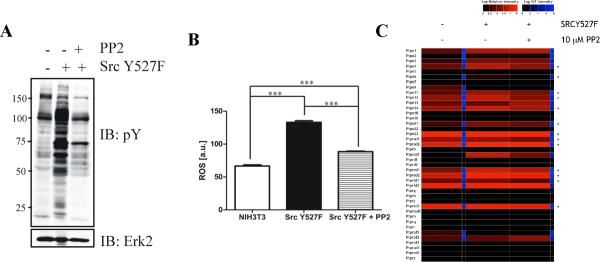
Figure 6. Reversibility of PTP oxidation in cancer cells following oncogene inhibition.
(A) Anti-phosphotyrosine immunoblot and (B) ROS levels of untransformed and Src Y527F cells treated with or without PP2, respectively. Data represent mean ± SEM (n=3; *** p<0.001, ANOVA with Bonferroni post-test). (C) Heat map showing effects of PP2 on levels of PTP oxidation in Src Y527F cells (n=2; 2 technical replicates each). * indicates PTPs with decreased oxidation following PP2 treatment.

