Fig. 2.
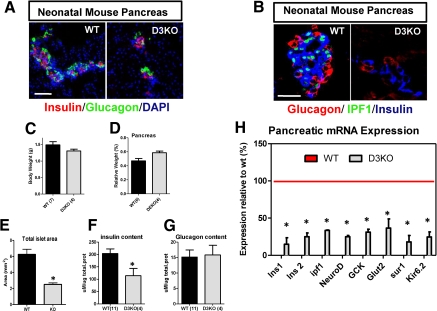
D3KO neonatal pancreatic islets are smaller and have less insulin content. A, Confocal immunofluorescence images of wild-type (WT) and homozygous D3KO (D3KO) neonatal mouse pancreatic tissue (P0) stained with α-insulin (red) and α-glucagon (green) antibodies, and 4′,6′-diamino-2-phenylindole (DAPI; blue). Bars, 50 μm. B, Confocal immunofluorescence images of wild-type (WT) and homozygous D3KO (D3KO) neonatal mouse pancreatic tissue (P0) stained with α-glucagon (red), α-ipf1/pdx1 (green), and α-insulin (blue) antibodies. Bars, 50 μm. C, Neonatal (P0) body weight in wild-type (WT; n = 7, back bar) and homozygous D3KO (n = 4, gray bar). Each bar represents mean ± sem. D, Relative pancreatic weight in wild-type (WT, n = 6, back bar) and homozygous D3KO (n = 4, gray bar). Each bar represents mean ± sem of total pancreatic weight normalized by body weight. E, Quantification of total neonatal (P0) pancreatic islet area in pancreatic sections from wild-type (WT; n = 5) and homozygous D3KO (KO; n = 4). Data represent mean ± sem. *, P < 0.05. F and G, Measurement of total insulin and glucagon content in isolated pancreas from (P0) neonatal wild-type (WT; n = 11, and homozygous D3KO, n = 4). Data represent mean ± sem. *, P < 0.05. H, Quantitative RT-PCR gene expression analysis of the indicated genes were performed using cDNA prepared from total pancreata of P0 wild-type (WT) and homozygous D3KO (D3KO). Data represented as percentage of expression relative to wild-type are considered 100% (red line). *, P < 0.05.

