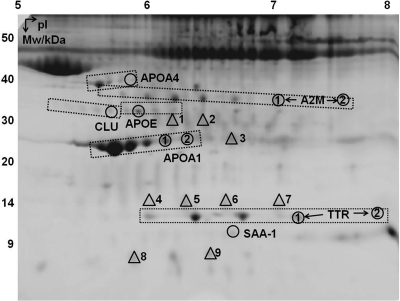
Fig. 2.
A 2-D gel image indicating proteins that are significantly altered by GH and/or IGF-I treatments. Abbreviations of the protein names are shown next to the circled spots with numbers differentiating multiple isoforms reported in this study. Triangles represent albumin, with nine different isoforms labeled 1–9. Dashed boxes encompass all isoforms identified for a particular protein; e.g. the box containing APOA1 isoforms 1 and 2 also included four other APOA1 spots. Only isoforms that were found to be significantly altered were assigned a number and described in detail in the text. Mw, Molecular weight; pI, isoelectric point.

