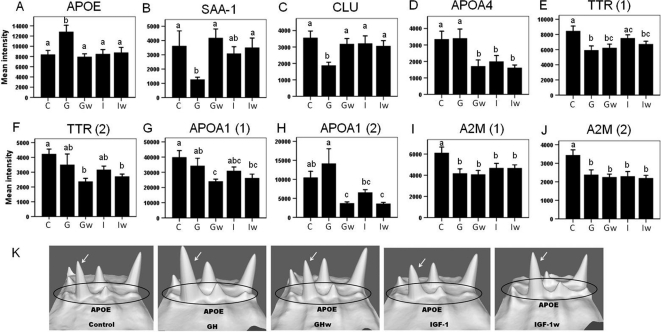
Fig. 3.
2-DE quantification of proteins that changed significantly due to GH or IGF-I treatment. Panels A–E, Proteins that show differential effects by GH vs. IGF-I; panels D–J, proteins that show significantly delayed or sustained changes by GH. Proteins isoforms correspond to those labeled in Fig. 2. Different letters denote significant differences (P < 0.05). Error bars represent sem from n = 14 mice per group. The x-axis represents five groups: C, control; G, GH; Gw, GHw; I, IGF-I; Iw, IGF-Iw. Panel K, 3-D view of spot intensities for APOE isoforms. Four peaks representing four APOE isoforms are circled, and the isoform corresponding to Figs. 2 and 3A is indicated by an arrow. The 3-D view is generated by PDQuest software (Bio-Rad).

