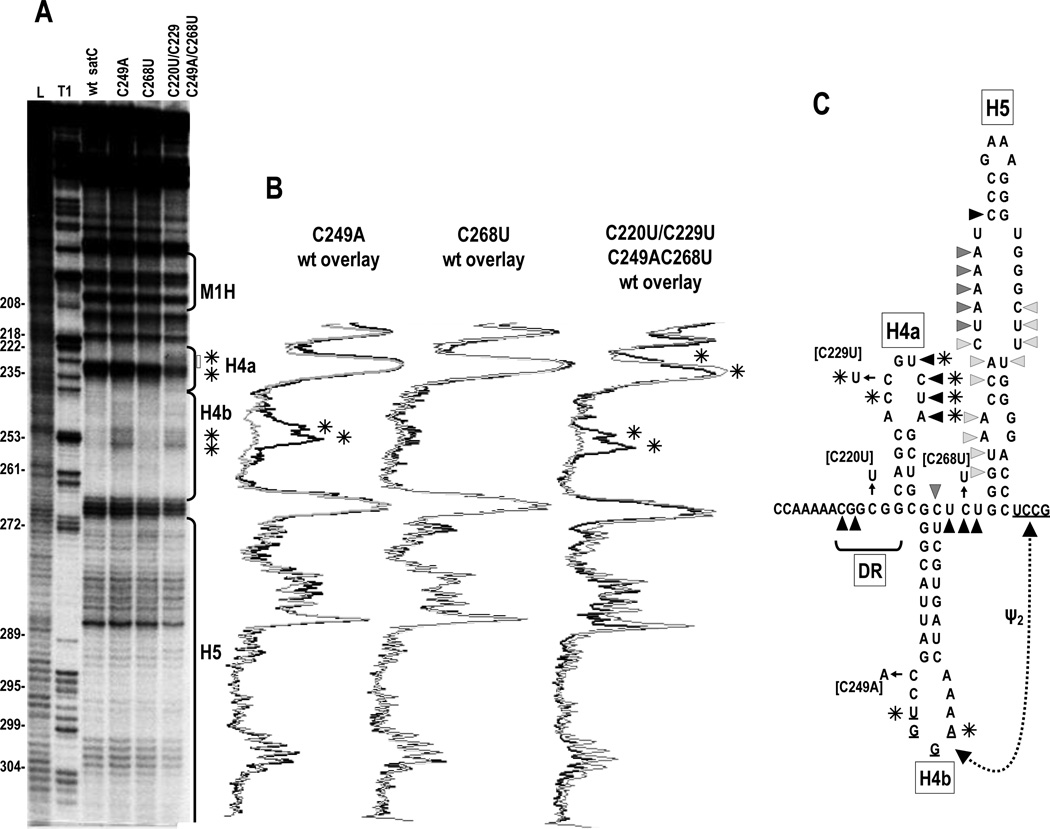
Fig. 3.
In-line probing of the 3' half of wt satC and various mutants. (A) Autoradiograph of a typical in-line probing of satC wt and mutant RNAs. Numbering is from the 5' end of satC. L, partial hydroxide cleavage ladder; T1, partial RNase T1 digestion of denatured RNA showing the location of guanylates. Locations of the hairpins are indicated to the right. Asterisks indicate differences between wt satC and C249A or C220U/C229U/C249A/C268U. (B) Overlays of densitometer tracings from mutant (dark tracings) and wt satC (light tracings). Asterisks denote consistent differences between mutant and wt satC from three in-line probings. (C) Position of residues susceptible to in-line cleavage. Darker triangles denote more intense cleavages. Asterisks denote location of nucleotides with enhanced susceptibility in C249A and C220U/C229U/C249A/C268U relative to wt satC.

