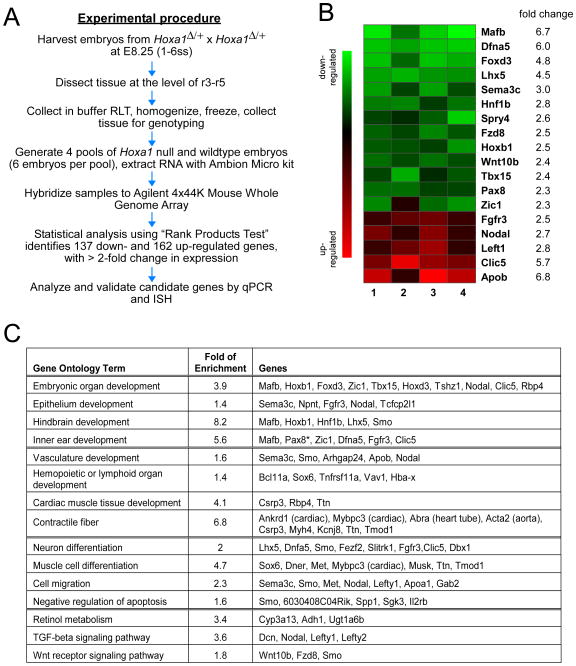
Fig. 3. Microarray analysis identifies novel Hoxa1 targets involved in various developmental processes.
(A) Flowchart showing the experimental procedure from embryo harvesting to validation of microarray targets. (B) Expression heat maps for relative expression of genes of interest obtained from four Agilent microarrays comparing Hoxa1Δ/Δ to control embryos. Green indicates decreased and red increased expression in mutants. Note the reproducible direction and magnitude of the changes. Fold changes are log base 2; P<0.0005. (C) Gene ontology (GO) analysis was performed on significantly differentially expressed genes using DAVID. Enriched GO terms for genes significantly down-regulated (green) or up-regulated (red), as well as fold of enrichment (compared to genome-wide background level) are listed. Asterisk indicates that the gene is involved in corresponding GO function but failed to be recognized by DAVID.

