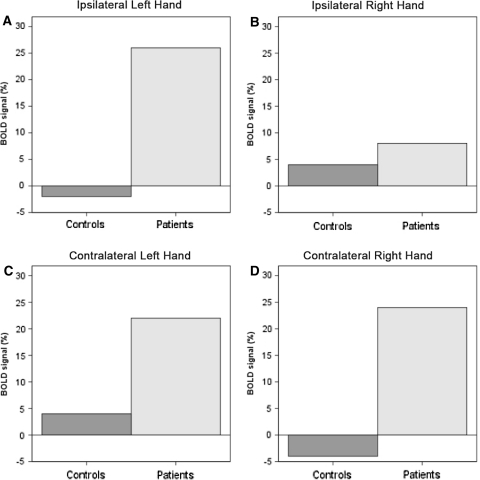
Fig. 2.
Changes in BOLD signal (%) when comparing patients and controls in the SMA. a Left SMA during left hand movement (ipsilateral to left hand movement) (p < 0.03). b Right SMA during right hand movement (ipsilateral to right hand movement) (p < 0.13). c Right SMA during left hand movement (contralateral to left hand movement) (p < 0.04). d Left SMA during right hand movement (contralateral to right hand movement) (p < 0.03)

