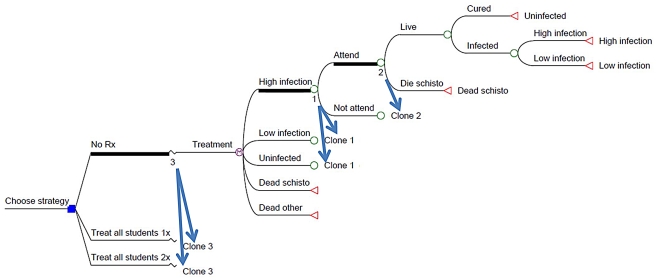
Figure 4. Schematic of the decision tree model used for cost-effectiveness analysis.
For each treatment strategy, individuals were cycled annually between three health states (uninfected, light, or heavy infection) or were lost to infection-related death or competing mortality. Transition was dependent on yearly participation with assigned treatment, or, if untreated, on the likelihood of spontaneous increase or reduction of infection without treatment. Input variables for the Markov model are listed in Tables S1 and S2. This is a simplified schematic of the full decision tree. Blue arrows indicate the places in the tree where ‘clones’ of the indicated sub-branches 1, 2, and 3 would be reproduced in the full tree diagram.

