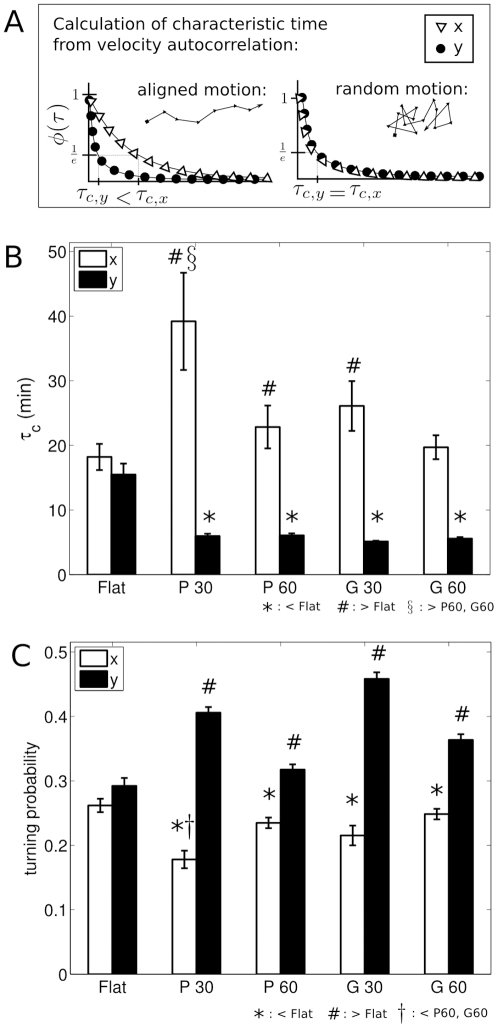
Figure 4. SC directionality was stronger on anisotropic than flat substrates, as measured by velocity autocorrelation and turning probabilities.
A. Cartoon demonstrating the calculation of characteristic drop off times,  and
and  , from the autocorrelation
  , based on theoretical aligned and unaligned motion. B. Characteristic drop off times,
  calculated from the velocity autocorrelation
  for each condition and direction. *,#: significant in Mann-Whitney U tests against
  .
.  : significant in multiple comparisons across anisotropic conditions with Sidak correction. C. Graph shows turning probability parallel (
 ) and perpendicular (
 ) to the topography. *, #: significant in pairwise t-test against flat overall turning probability.
  : significant in multiple comparisons across anisotropic conditions with Sidak correction.

