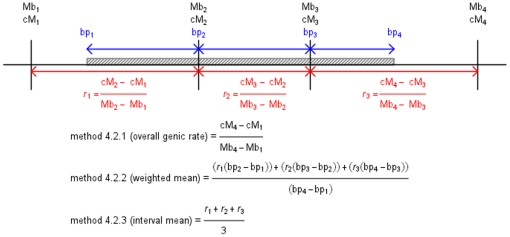
Figure 1. Methodologies used to generate gene-focused recombination rates.
Representation of the methods used to calculate gene-focused recombination rates (methods 4.2.1, 4.2.2 and 4.2.3). Note that this diagram is for descriptive purposes only and is not to scale. For simplicity, only calculations for mean rates are shown. The grey region is a gene. Vertical black lines represent four SNP markers with physical (Mb) and genetic (cM) positions. Blue arrows represent the base pairs of the gene overlapping with each intervening SNP interval. In red are recombination rates (rx) between pairs of neighbouring markers.

