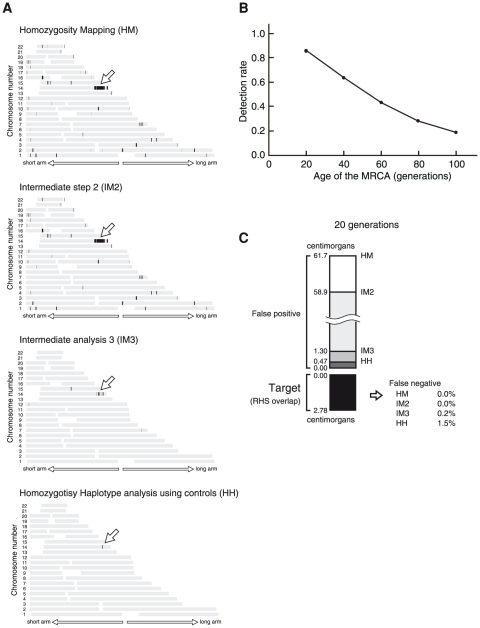
Figure 3. HM on HH analysis of a pair.
(A) Analysis of patients 1 and 2 with Siiyama-type α1-antitrypsin deficiency. The position of the disease-causing gene (SERPINA1) is indicated by an arrow. HM on HH analysis is composed of 4 steps that are sequentially performed. The regions selected after each step are shown as black bands. The total length of the regions selected at the end was 1.36 centimorgans. (B) The rate at which the RHS overlap was detected by the HM step (i.e., the first step of the analysis) was the major determinant of HM on HH analysis. The detection rate will be improved by genotyping more SNPs genomewide. (C) False positives and false negatives for each analysis. False negatives are decreased with the progression of the analyses. False negatives are very few: 1.5% of the RHS overlap detected by the HM analysis is falsely excluded by HM on HH analysis.

