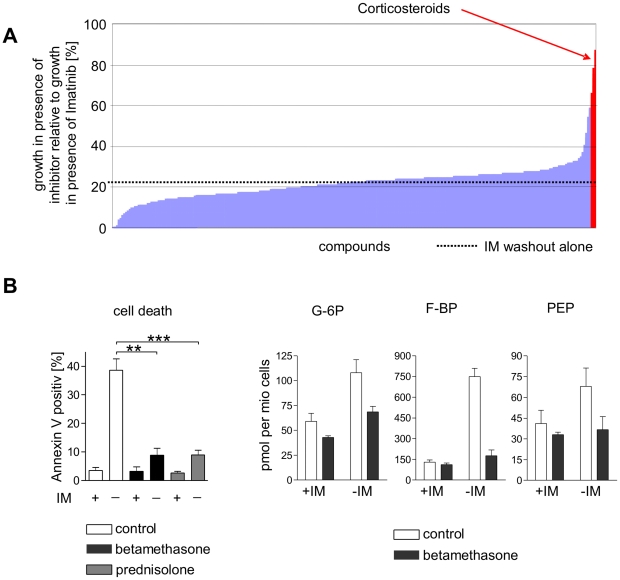
Figure 5. Modulation of cell death and altered metabolism induced by imatinib withdrawal in IMR cells.
(A) Effects of a panel of 1,120 approved small molecule inhibitors (Prestwick library) on cell survival upon imatinib-deprivation. Cells were incubated with DMSO control, inhibitors and with or without imatinib for 48 hours and cell survival was then measured by MTT colorimetric analysis. Values reflect percent survival of cells treated with inhibitor in absence of imatinib in relation to imatinib treated controls. Survival of imatinib withdrawal alone is indicated by a dotted line. (B) Effects of betamethasone (**: P = 0.001) and prednisolone (***: P<0.0001) on induction of cell death (left panel) and glucose metabolism (right panel) on imatinib withdrawal induced cell death. Cells were cultivated in the presence or absence of betamethasone, prednisolone, and imatinib for 48 hours and then harvested for cell death quantification by Annexin V staining and flow cytometry (left panel) or for fixation and preparation for GC-MS or LC-MS-MS (right panel). Values reflect means ± SD from 3 experiments.

