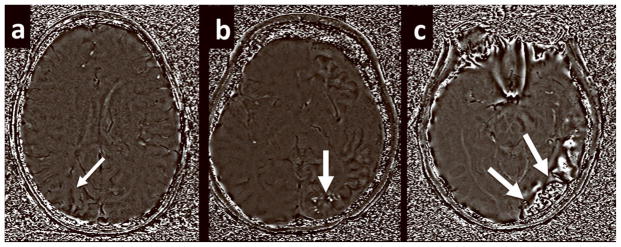
Figure 1.
Examples of how the calcium score was determined based on the phase component images of the SWI data set. (a) A score of 0 was assigned to affected areas without high signal on the phase images. (b) A score of 1 was assigned to areas of punctate foci of high intensity. (c) A score of 2 was assigned to areas of linear hyperintensity.

