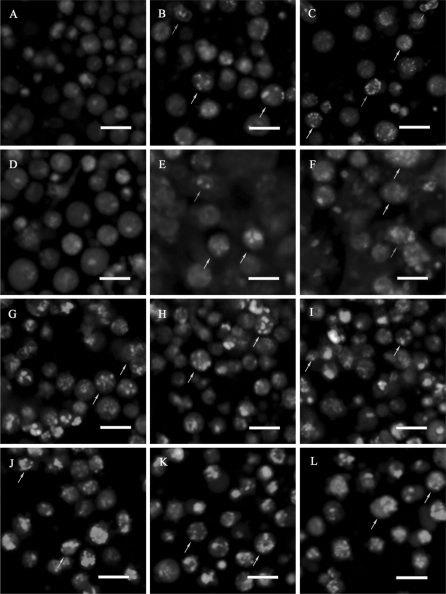
Fig. 2.
Morphological observation of CEFs using AO/EB double staining. (a–c) (g–i) samples treated for 24 h; (d–f) (j–l) samples treated for 48 h; (a, d) controls; and cells treated with (b, e) H2O2 10 μM; (c, f) H2O2 100 μM; (g, j) Vc 0 μM; (H, K) Vc 50 μM; and (i, l) Vc 500 μM. Cells for functional investigation of Vc are cultured in media supplemented with 2 μg/mL doxorubicin. Normal cells displayed evenly distributed brown fluorescence; apoptotic cells possessed brown cytosol and condensed brown nuclei; necrotic cells exhibited red cytosol and condensed red nuclei; dead cells through other pathways displayed evenly distributed red fluorescence. Brown arrows point to representative apoptotic cells, and red arrows point to representative necrotic cells. Scale bars = 20 μm. (Color figure online)

