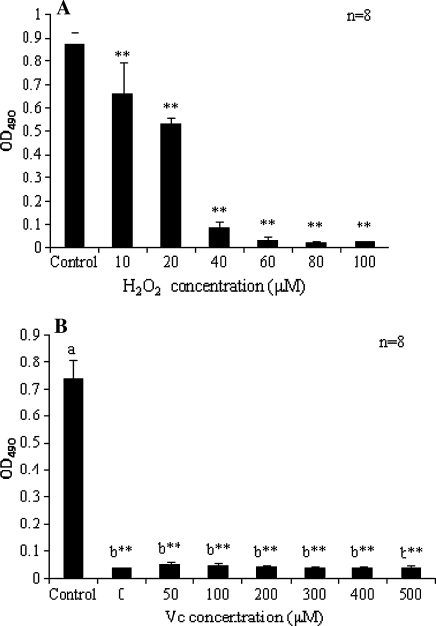
Fig. 4.
Cytotoxicity analysis of cells treated with a H2O2 and b Vc coincubated with 2 μg/mL Doxorubicin. OD values are corresponding to viable cell population. Different letters signify statistically significance (P < 0.05). Statistical significance compared with corresponding controls is marked with **P < 0.0001)

