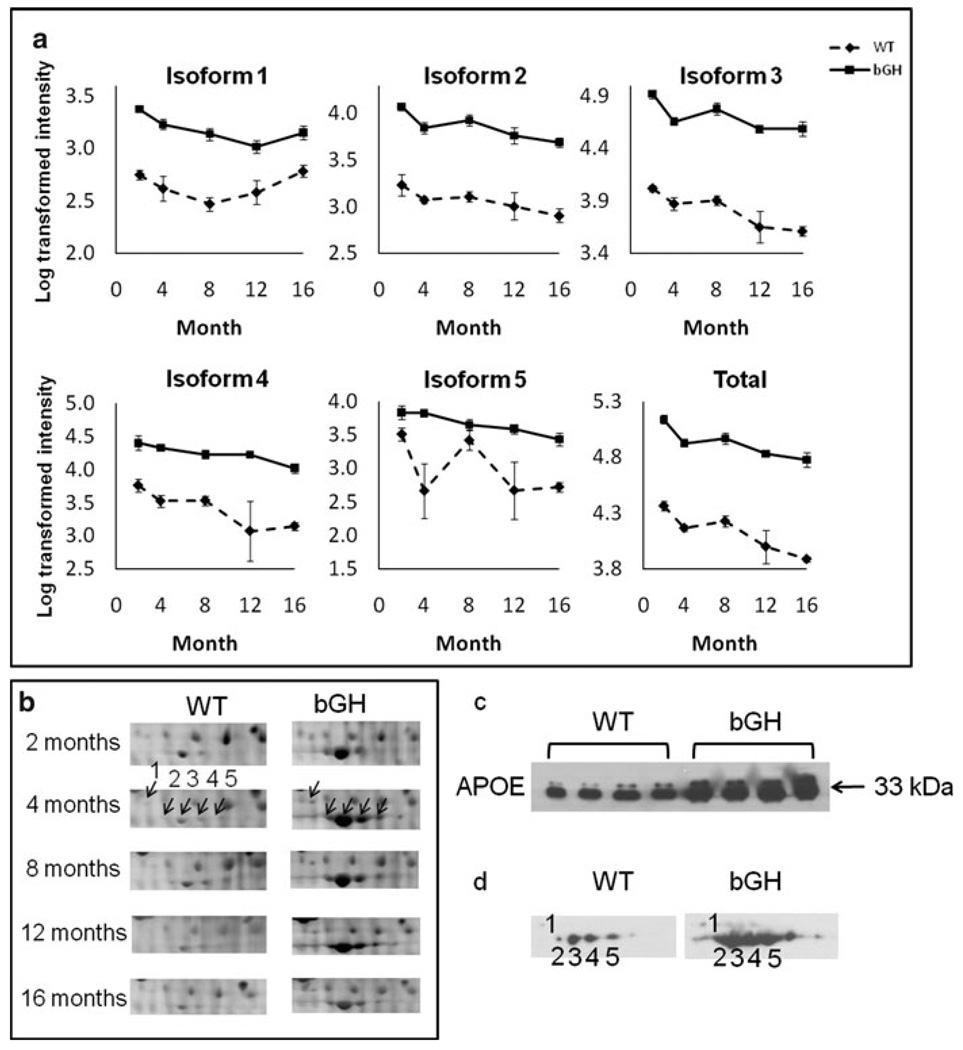
Fig. 3.
APOE was up-regulated in bGH compared to WT mice. a Quantification of individual isoforms as well as total APOE. The isoform number corresponds to those in Fig. 2. Total APOE is calculated as the sum intensity of all APOE isoforms. The Y axis represents log-transformed intensity. Two-way repeated measures ANOVA revealed a significant effect of genotype: isoform 1, F(1,15) = 159.1, P = 2 × 10⁻⁹; isoform 2, F(1,15) = 320.7, P = 2 × 10⁻¹¹; isoform 3, F(1,15) = 443.3, P = 2 × 10⁻¹²; isoform 4, F(1,15) = 65.9, P = 7 × 10⁻⁷; isoform 5, F(1,15) = 25.5, P = 0.0001; total apoE, F(1,15) = 442.1, P = 2 × 10⁻¹². b Cropped image of one representative gel from WT and bGH mice at each age. The arrows point to individual apoE isoforms at 4 months, with the numbers corresponding to isoform numbers. c 1-D Western blotting of APOE using 8-month old mouse plasma samples (n = 4 for each genotype). d 2-D Western blotting of APOE from one WT and one bGH mouse at 8 months of age. Isoforms 1–5 labeled on the X-ray film images correspond to APOE isoforms 1–5 in Fig. 2. Equal loading of protein samples was confirmed by PageBlue staining of gels (not shown)

