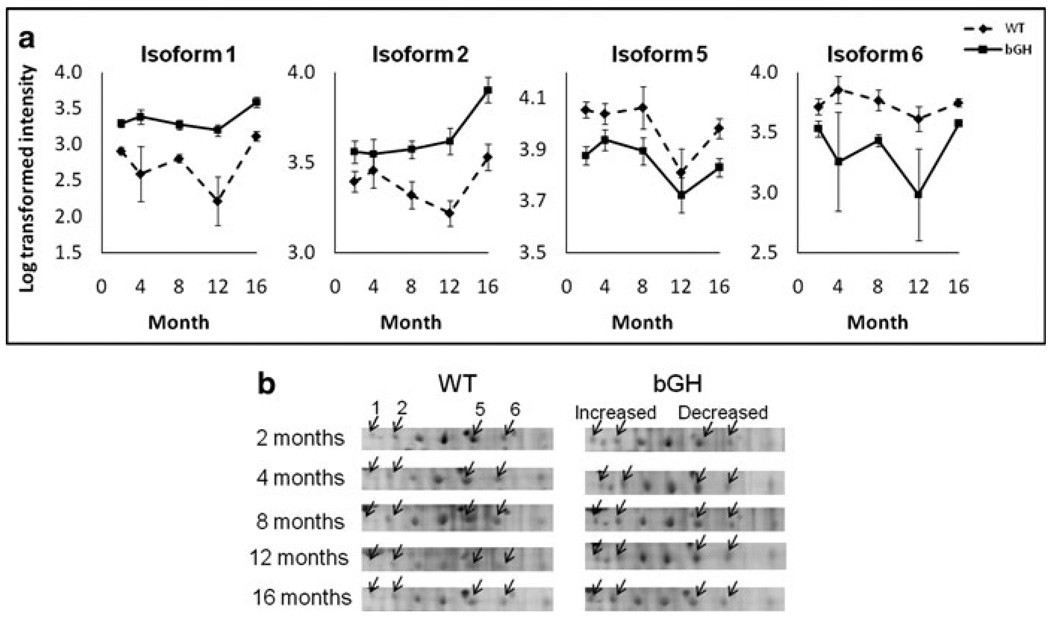
Fig. 5.
Isoform-specific changes of A2M in bGH compared to WT mice, with isoforms 1 and 2 up-regulated while isoforms 5 and 6 down-regulated. a Quantification of A2M isoforms. The isoform number corresponds to Fig. 2. The Y axis represents log-transformed intensity. Two-way repeated measures ANOVA revealed a significant effect of genotype: isoform 1, F(1,15) = 46.7, P = 6 × 10⁻⁶; isoform 2, F(1,15) = 17.8, P = 0.007; isoform 5, F(1,15) = 11.2, P = 0.004; isoform 6, F(1,15) = 9.8, P = 0.007. b cropped image of one representative gel from WT and bGH mice at each age. The arrows point to A2M isoforms 1, 2, 5 and 6

