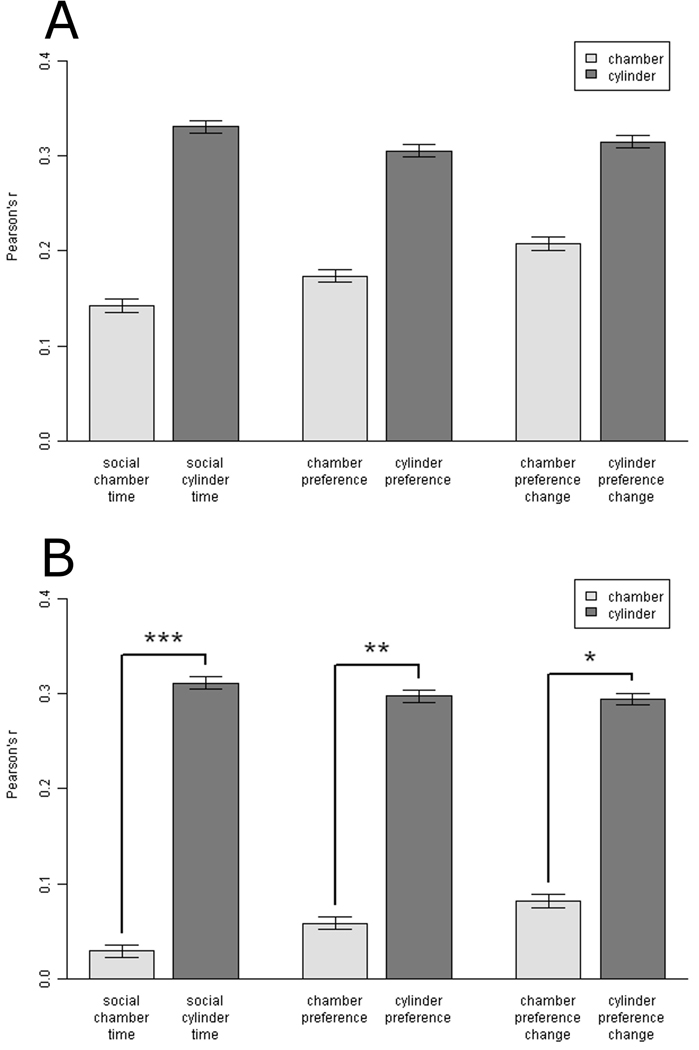
Fig. 3.
Ecological validity of the six sociability scores. (A) Each sociability score from Day 1 of testing was correlated with the Phase 3 (Free Social Interaction) score from Day 2. There were no significant differences among the scores. N = 146. Pearson’s r ± SE. (B) Each sociability score from Day 2 of testing was correlated with the Phase 3 (Free Social Interaction) score from Day 2. N = 146. Pearson’s r ± SE. The three cylinder scores showed higher correlations than the three chamber scores, P < 0.01. *P < 0.05, **P < 0.01, ***P < 0.001, for pairwise comparisons, chamber vs. cylinder score.

