Fig 2.
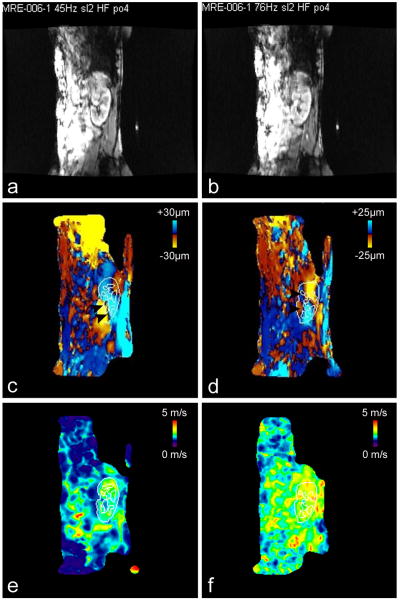
Images obtained in volunteer 6 (first examination)
2a-b: magnitudes images of the 45 Hz (Fig 2a) and 76 Hz (Fig 2b) MRE acquisitions, showing the position of the kidney
2c-d: corresponding phase images (motion encoding gradients in the Head-Feet direction) obtained at 45 Hz (Fig 2c) and 76 Hz (Fig 2d) and showing shear waves (black arrowheads) traveling through the kidney. The outline (reported from the magnitude images) shows renal cortex and medulla. Such outlines were used to calculate the mean velocities in the cortex, the medulla and the whole parenchyma (cortex and medulla).
2e-f: corresponding shear velocity maps (HFxAP combination) obtained at 45 Hz (Fig 2e) and 76 Hz (Fig 2f).

