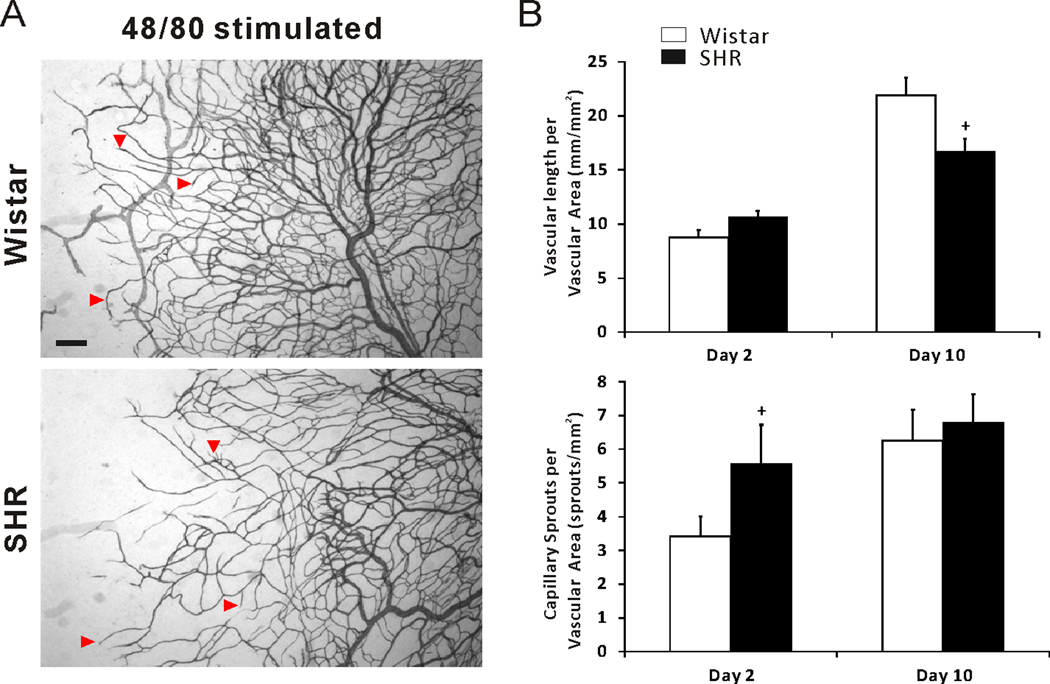
Figure 7.
(A) Representative mesenteric adult SHR and Wistar microvascular networks during 48/80 mast cell degranulation induced microvascular growth at day 2 and 10 post stimulation. (B) Comparison of vascular length per vascular area and capillary sprouts per vascular area in Wistar versus SHR mesenteric tissues. Arrowheads indicate examples of capillary sprouting. + represents significant difference between SHR and Wistar groups (p < 0.05).

