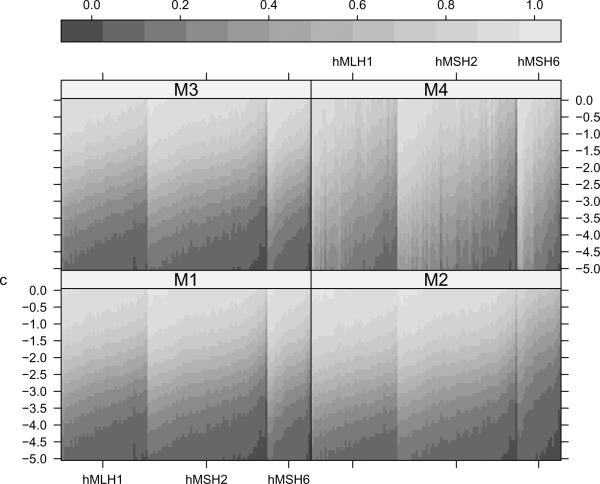
Figure 2.
Estimated posterior distribution functions of b1i, namely for i = 1, …, 124, all families in our dataset. The y-axis gives the threshold in years, and the grayscale reflects the corresponding probability. Families (along the x-axis) are ordered first by mutation status (43 hMLH1, 59 hMSH2 and 22 hMSH6 families are represented) and then by the posterior median of b1i as predicted by M1 within each mutation subtype. c signifies the reduction in number of years in AOO for successive generations. Thus a substantial probability of falling below a negative threshold value indicates evidence of anticipation for that family.

