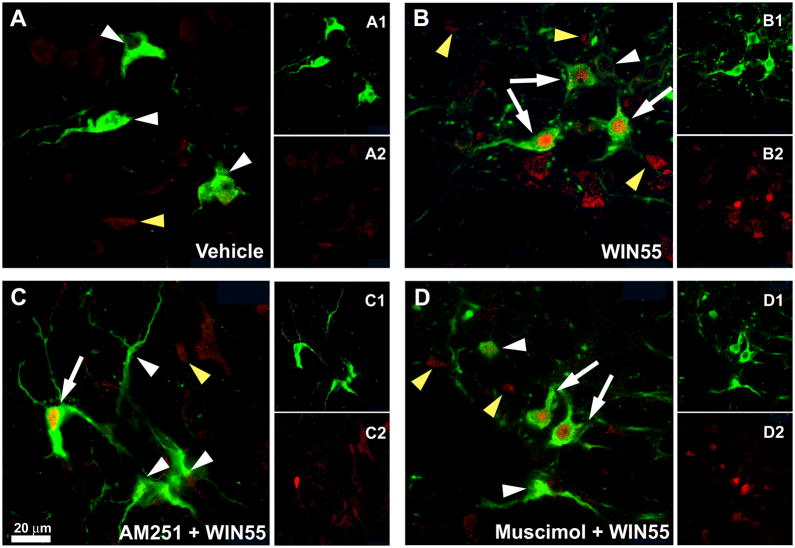
Figure 4. Dual-labeling immunofluorescence photomicrographs depicting CB1R-induced c-Fos expression in catecholaminergic neurons in the RVLM.
Confocal dual-channel images showing tyrosine hydroxylase immunoreactive (TH-ir) neurons (green) and c-Fos immunoreactive (Fos-ir) cell nuclei (red) in RVLM of rats treated as described under methods with (A) vehicle, (B) 15 μg WIN55,212-2, (C) AM251 + 15 μg WIN55,212-2 and (D) Muscimol + 15 μg WIN55,212-2. White or yellow arrowheads indicate single labeled TH-ir neurons or c-Fos-ir cell nuclei, respectively. White arrows denote c-Fos/TH co-labeled cells. Scale bar, 20 μm.

