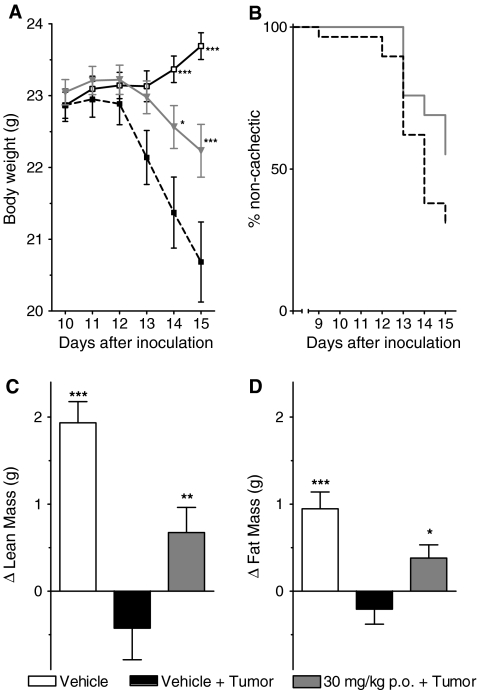
Fig. 3.
The effects of BL-6020/979 in C26 tumor-bearing mice. a Mean body weight development of vehicle control (open squares), vehicle + tumor control (closed squares), and BL-6020/979 30 mg/kg (gray triangles) group. b Kaplan–Meyer plot for vehicle control (black line) and BL-6020/979 30 mg/kg (gray line) treated tumor-bearing groups. Occurrence of cachexia was defined as loss of more than 5% of body mass during the course of the experiment. Difference in lean body mass (c) and fat mass (d) between day of tumor inoculation (day 0) and end of experiment (day 15). Note: all graphs are average from three independent experiments, each with n = 9–10 per group. Each value represents mean ± SEM. Statistical difference vs. vehicle + tumor in post hoc testing is signified as *p < 0.05, ***p < 0.001

