
Figure 4.
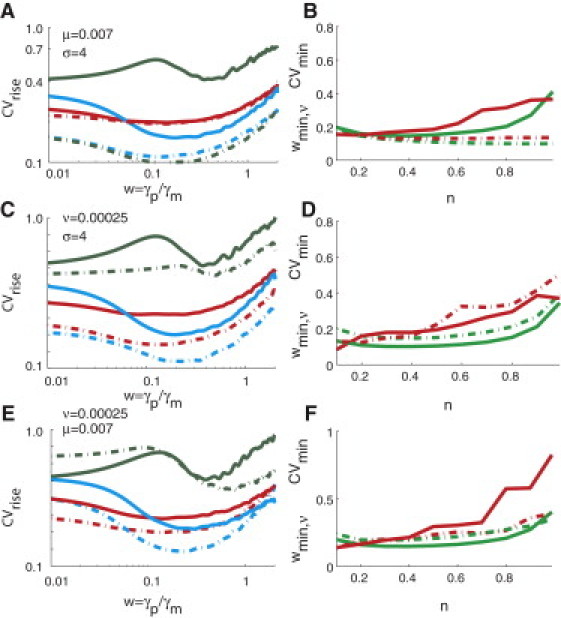
Robustness of optimum range of w against changes in other parameters (σ, μ, and ν) in negatively autoregulated network: We further characterize the parameter landscape to describe the dependence of the coefficient of variation of the rise-n-times on the perturbation parameters w, ν, σ, and μ. We show these dependencies on several two-dimensional plots. All these plots were obtained by numerical integration of Eq. 3 for the negatively autoregulated network. (A, C, and E) Curve color denotes different values of n (green, n = 0.1; blue, n = 0.5; and red, n = 0.99). (A) Variation of CVrise (log scale) as a function of w (log scale) for ν = 0.00025 (solid curves) and ν = 0.025 (dashed-dotted curves). (σ = 4; μ = 0.007.) (C) Variation of CVrise (log scale) as a function of w (log scale) for μ = 0.007 (solid curves) and μ = 0.07 (dashed-dotted curves). (σ = 4; ν = 0.00025.) (E) Variation of CVrise (log scale) as a function of w (log scale) for σ = 4 (solid curves) and σ = 100 (dashed-dotted curves). (ν = 0.00025; μ = 0.007.) (B, D, and F) (B) Variation of CVmin (red) and wmin,τ (green) as a function n for ν = 0.00025 (solid curve) and ν = 0.025 (dashed-dotted curve). As ν increases, CVmin decreases monotonically. (D) Variation of CVmin (red) and wmin,τ (green) as a function n for μ = 0.007 (solid curve) and μ = 0.07 (dashed-dotted curve). (F) Variation of CVmin (red) and wmin,τ (green) as a function n for σ = 4 (solid curve) and σ = 100 (dashed-dotted curve).