
Figure 1.
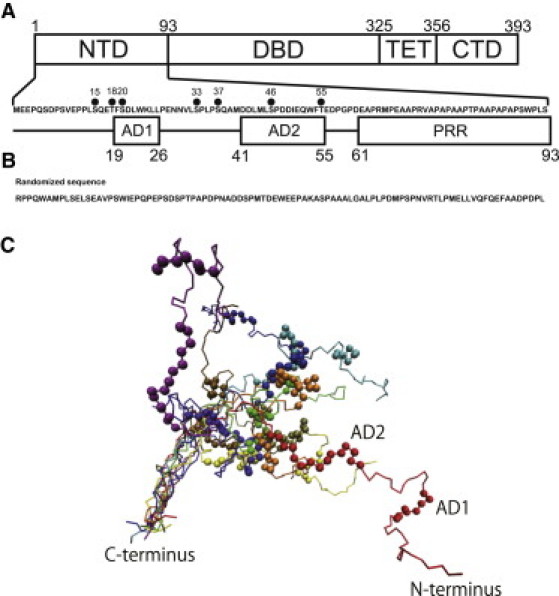
Sequences and structures of simulated systems. (A) Schematic of p53 domain organization showing N-terminal domain (NTD), DNA-binding domain (DBD), tetramerization domain (TET), and C-terminal domain (CTD). The sequence of human p53 NTD is shown and known sites of phosphorylation are indicated by black dots. The AD1, AD2 and PRR motifs are indicated. (B) A random sequence of 93 residues obtained by shuffling the p53 NTD sequence. (C) Ten representative structures from the structural ensemble of p53 NTD. These structures are superimposed by using C-terminal 30 residues (roughly corresponding to the PRR region). Each chain is represented by a different color, and AD1 and AD2 are represented by bead models.