
Figure 2.
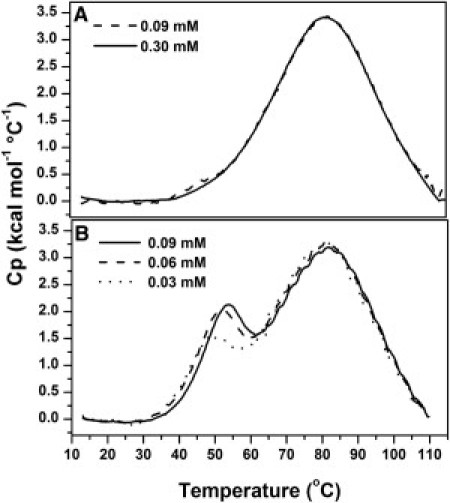
Calorimetric profiles of the thermal perturbation of WGA as a function of protein concentration at (A) pH 2 and (B) pH 3, 30 mM Gly/HCl.
Official websites use .gov
A
.gov website belongs to an official
government organization in the United States.
Secure .gov websites use HTTPS
A lock (
) or https:// means you've safely
connected to the .gov website. Share sensitive
information only on official, secure websites.
Calorimetric profiles of the thermal perturbation of WGA as a function of protein concentration at (A) pH 2 and (B) pH 3, 30 mM Gly/HCl.