
Figure 2.
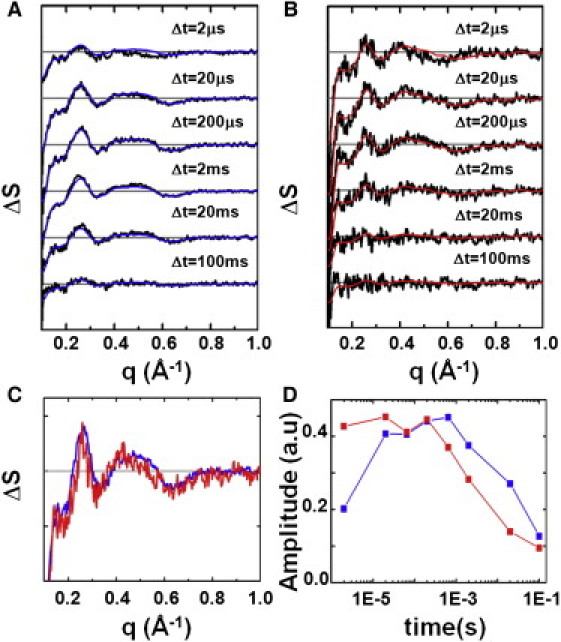
Time-resolved difference WAXS data and spectral decomposition. Time-resolved difference WAXS data collected at pH 9.0 (23°C) for (A) native pR and (B) 13-I-pR for the representative time delays after laser excitation. All curves have had the solvent response due to sample heating removed. (Blue and red solid lines) Each time-delay recalculated using only the major component from SVD analysis (see Materials and Methods). (Gray line) ΔS(q,Δt) = 0. Basis spectra (C) and amplitudes (D) of the major signal containing component from SVD for native pR (blue) and 13-I-pR (red).