
Figure 5.
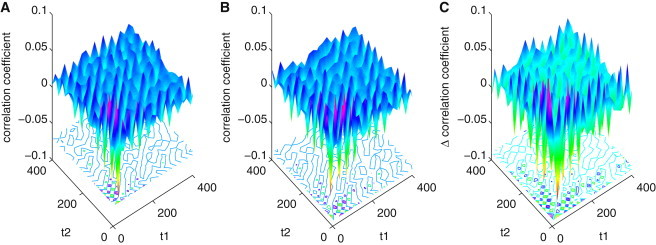
(A and B) Three-point autocorrelation function: x(t0), x(t0 + t1), and x(t0 + t1 + t2) and its time reversal x(t), x(t − t1), and x(t − t1 − t2) for variable Mp (mRNA) when V = 200. From the contour map, it can be seen that the results of correlation function in panels A and B are obviously different, which can also be found in panel C. (C) Difference between panels A and B. It should be noticed that the scales of difference of panels A and B are between −0.1 and 0.1, which approximate the scales of these two correlation functions themselves; they are obviously different.