
Figure 6.
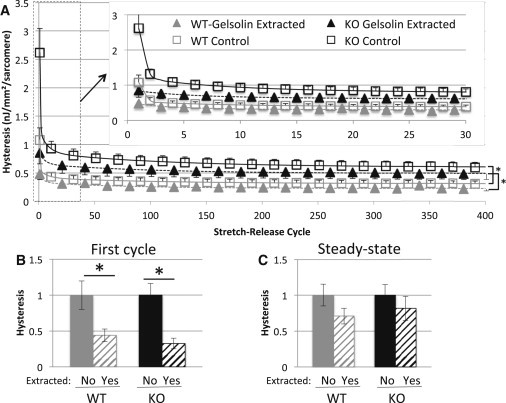
Physiological hysteresis in thin filament extracted myocardium. (A) Hysteresis as a function of cycle number. WT tissue is shown in gray, KO tissue is shown in black. Gelsolin-extracted tissue is indicated by solid triangles while control (nongelsolin extracted) tissue is shown by open square boxes. For the larger graph, every 20th point is shown with the selected gelsolin extracted points offset from nonextracted points by 10 cycles (for clarity reasons). The inset shows an expanded version of the first 30 cycles. (B and C) Hysteresis of the initial stretch-release cycle (B) and the steady state after 400 cycles (C). (Hysteresis is normalized to that of the unextracted tissue.) Hysteresis is decreased by ∼60% for the initial triangle stretch in gelsolin-extracted rested muscle compared to genotype-matched controls. However, this difference quickly diminishes and steady-state hysteresis values are not significantly different in extracted versus nonextracted tissues.