
Figure 7.
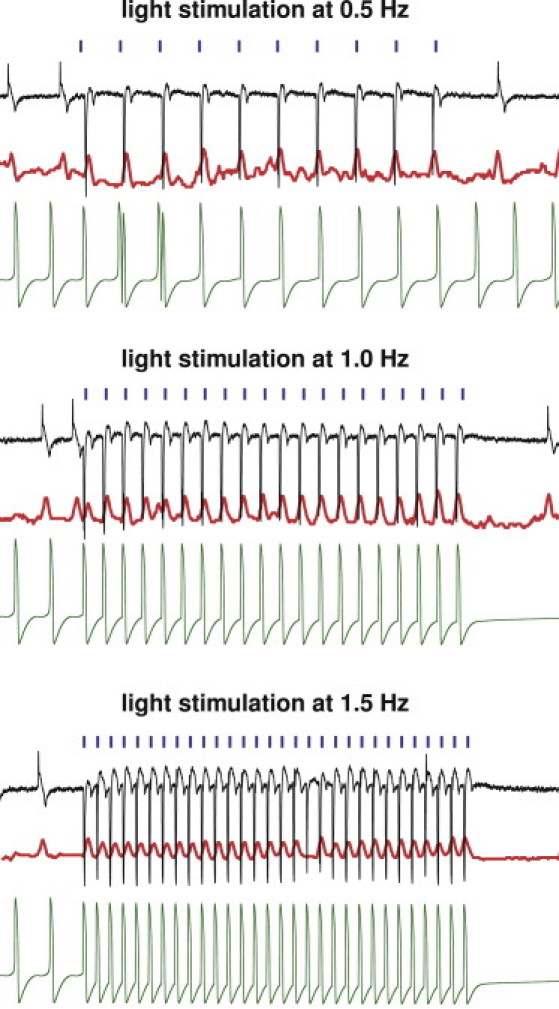
Experimental and computational sensitivity of hESCChR2-CM with respect to stimulation frequency. Light stimulation (blue) evokes field potentials (black) that translate into mechanical contractions (red). Light stimulation at 100% intensity is performed at 0.5 Hz (top), 1.0 Hz (middle), and 1.5 Hz (bottom). Evoked signals during light stimulation (center) are markedly different from pre- and poststimulation signals at all frequencies (left and right). The computational hESCChR2-CM model (green) captures the electrical signal at all frequencies, both during light stimulation (center), and pre- and poststimulation (left and right).