
Figure 5.
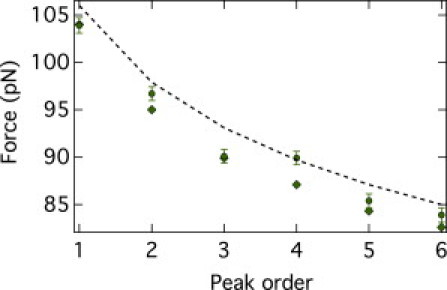
Average unfolding force versus peak order for the Langevin (circles) and BC (diamonds) from the distribution of unfolding forces of the peak order n = 1 stemming from the Langevin simulation and kinetic model (dashed line). The statistical errors (mean ± SD) are shown with error bars for the Langevin simulation, whereas for the BC data, the errors are the same size as the symbols (∼0.5 pN).