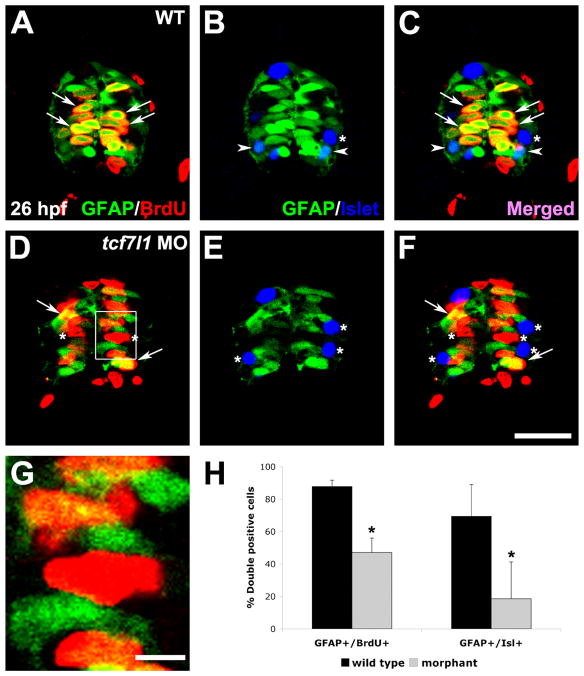
Figure 2. gfap:gfp expression is lost in tcf7l1 morphants.
(A–F) Cross-sections through the spinal cord at 26 hpf. (A–C) Tg(gfap:GFP)mi2001 embryo co-labeled for BrdU and Isl1/2, following 20 minutes of BrdU incubation. (D–F) tcf7l1a/b morpholino-injected Tg(gfap:GFP)mi2001 embryo labeled as described above. Arrows indicate GFP+/BrdU+ cells, arrowheads indicate GFP+/Isl+ cells, and asterisks indicate GFP−/BrdU+ or GFP−/Isl+ cells. (G) Higher magnification view of box in (D). (H) Percent of double-positive cells/section in wild-type and tcf7l1 morphant spinal cords. Error bars indicate SD and asterisks indicate statistical significance. p < 0.001 by Student’s unpaired t-test. n=9 sections from 3 individual embryos for each bar. Scale bars = 20μM in F, 5μM in G.

