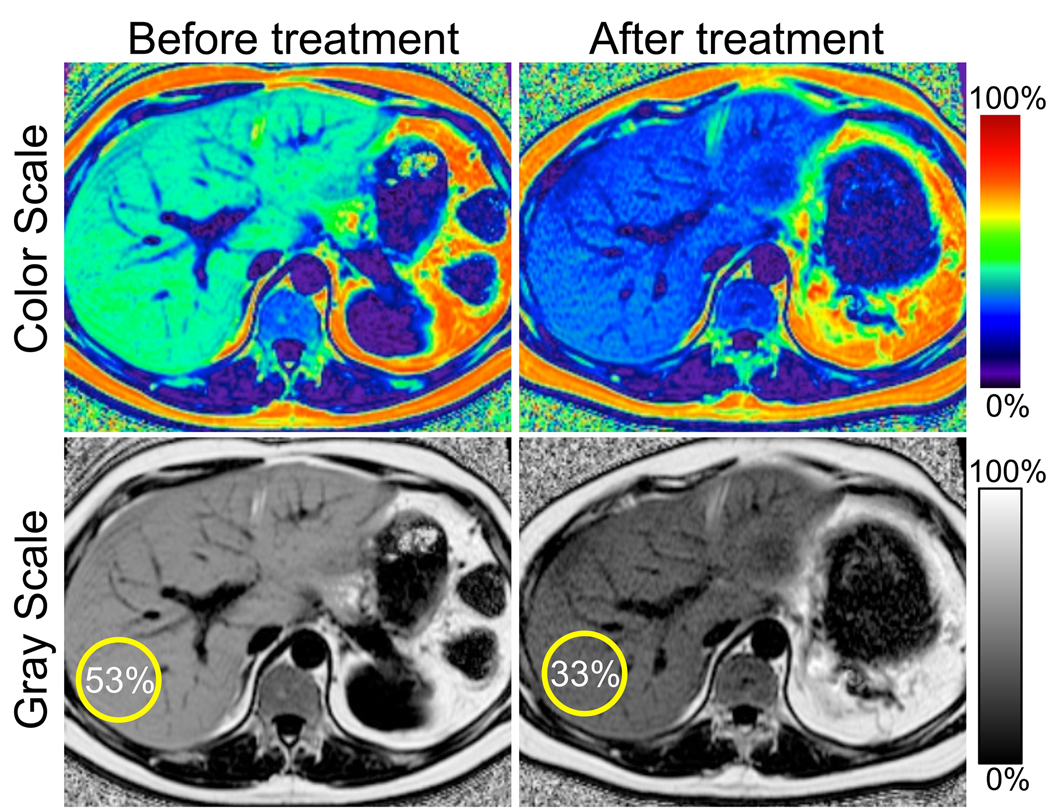
Figure 13.
Serial liver MRI exams can be used to demonstrate changes in liver fat during therapy. Serial PDFF maps obtained with complex-based MRI were acquired in a 41 year-old man with hypertriglyceridemia and insulin resistance undergoing plasmapheresis and multi-drug therapy to lower serum triglycerides. Follow-up MRI demonstrates reduction in hepatic PDFF (from 53% to 33%). Notice the corresponding reduction in liver size. This example demonstrates that fat-fractions greater than 50% may occur, and it also illustrates the use of gray-scale and color-scale PDFF maps.

