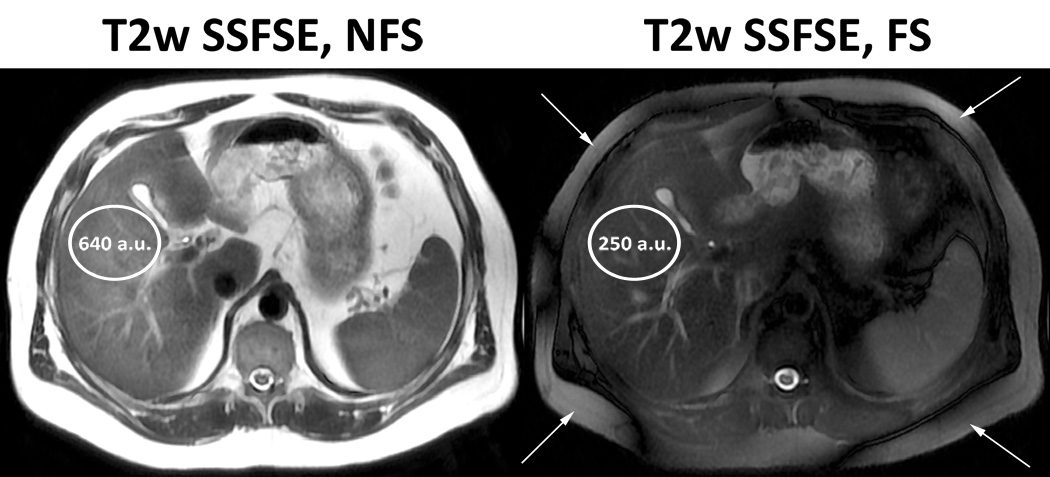
Figure 2.
Signal fat-fraction using fat-suppressed MRI technique, acquired in a 32 year-old man with fatty liver disease. Axial T2-weighted single shot fast spin echo images of the liver acquired with no fat saturation (NFS, left) and with fat saturation (FS, right). The signal in a co-localized region of interest (oval) is 640 arbitrary units (a.u.) in the NFS image and 250 a.u. in the FS image. Using Equation 2, the calculated signal fat-fraction is (640–250)/640 = 61%. The true fat-fraction by MR spectroscopy (not shown) is 17%, illustrating that the fat-suppressed MRI techniques may produce erroneous estimates of hepatic fat-content. Incomplete fat saturation and inadvertent water suppression (arrows) are potential pitfalls with fat-suppressed MRI techniques.

