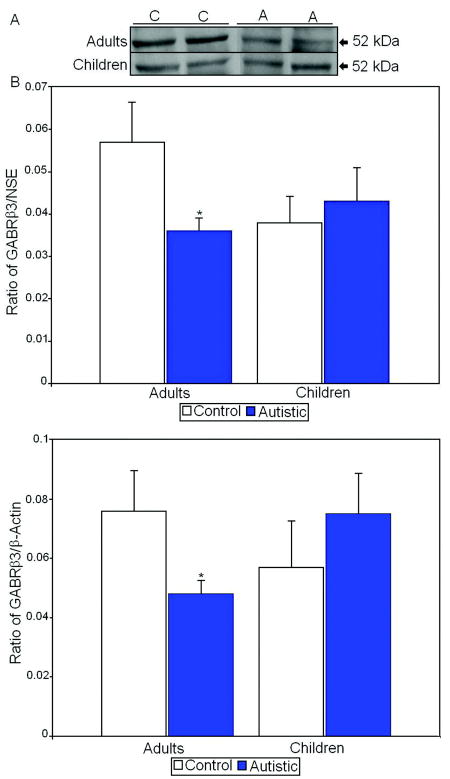
Figure 4.
A. Representative samples of GABRβ3 from control (C) and autistic (A) subjects. B. Mean GABRβ3/NSE ratios for autistic (filled histogram bars) and control subjects are shown for vermis. C. Mean GABRβ3/ β-actin ratios for autistic (filled histogram bars) and control subjects are shown for vermis. (Error bars expressed as standard error of the mean.) *, p<0.05.

