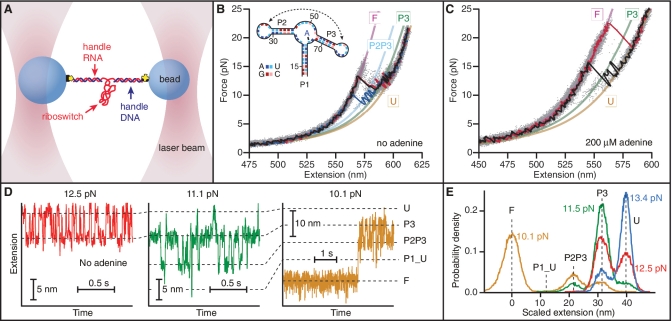
Figure 1.
Force spectroscopy of add aptamer alone. (A) RNA containing the riboswitch aptamer flanked by 2 kb-long handle sequences was annealed to DNA strands complementary to the handles and attached to beads held in optical traps. (B) FECs in the absence of adenine reveal two intermediate states corresponding to the unfolding of everything except hairpins P2 and P3, followed by hairpin P2. Three FECs (black, blue, red) are plotted above the aggregated data from 700 FECs (grey dots). WLC fits are shown for the four states: F, fully folded (purple); U, fully-unfolded (yellow); P3–P3, folded (green) and P2P3, both P2 and P3 folded (cyan). (C) Adenine binding resulted in similar behaviour but higher unfolding forces. State P2P3 was observed less frequently if at all. (D) The extension as a function of time at different levels of constant force in the absence of adenine reveals five distinct states corresponding to the major structural features: fully-unfolded at the largest extension (‘U’), then P3 folded (‘P3’), then both P2 and P3 folded but no loop–loop interaction (‘P2P3’), then the P2–P3 kissing loop complex (labelled ‘P1_U’, P1 unfolded) and finally fully-folded (‘F’). Only short segments of the full records are displayed. (E) Histograms of the full extension records show force-dependent occupancies of the states. The P1_U state always has low occupancy.

