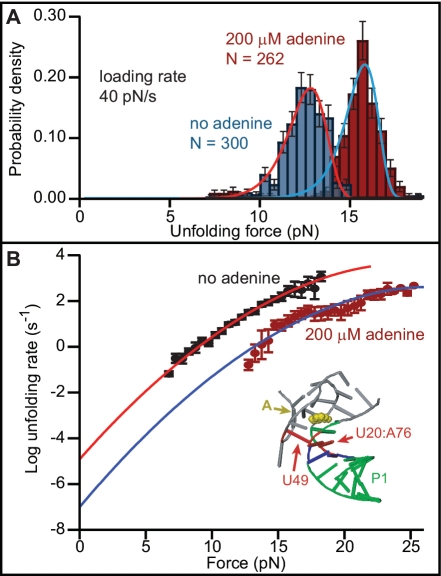
Figure 2.
Unfolding force distributions and force-dependent rates determined from FECs. (A) The unfolding force is higher with adenine bound (red) than without adenine (blue). Solid lines: fits to Equation (1). Error bars show SD. (B) Unfolding rate as a function of force, fit to Equation (2). Error bars show SEM. The barrier to unfolding is located at the first base triple between P1 and the junction loop (inset, red).

