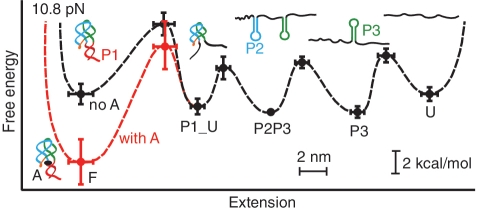
Figure 3.
Folding energy landscapes. The key features of the energy landscapes for the five-state native folding pathway were reconstructed from piecewise two-state analyses of each transition. Energies and positions are plotted with reference to the P2P3 state. Error bars show SEM. Dotted lines indicate notional landscape shapes in the presence (red) and absence (black) of adenine. Cartoons indicate the structural features associated with each state.

