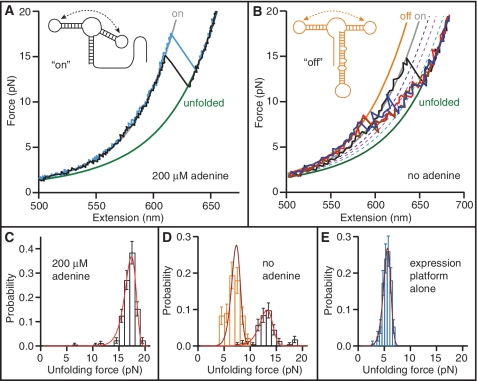
Figure 5.
FECs of the full-length riboswitch. (A) With adenine bound, the aptamer is folded (‘on’ state) and the contour length change is the same as for the aptamer alone. Solid lines: fits to ‘on’ (grey) and unfolded (green) states. Inset: secondary structure in the ‘on’ state. (B) Without adenine, the expression platform is folded (red, blue, brown) more often than the aptamer (black). Solid lines indicate fits to ‘on’ (grey), ‘off’ (orange) and unfolded (green) states. Dotted lines indicate partially-folded intermediates of the aptamer alone: P1_U (blue), P2P3 (pink) and P3 (cyan). Inset: secondary structure in the ‘off’ state. (C) The unfolding force distribution of FECs measured with adenine present matches that expected for the adenine-bound aptamer. Red line: fit to Equation (1). (D) The unfolding force distribution without adenine reveals two sub-populations. The higher-force peak (black) comes from curves initially in the ‘on’ state and matches the distribution expected for the adenine-free aptamer [red line: fit to Equation (1)]. The lower peak (orange) comes from curves initially in the ‘off’ state and matches the distribution expected for the expression platform alone [brown line: fit to Equation (1)]. (E) Unfolding force distribution of the expression platform alone [brown line: fit to Equation (1)]. The most likely force is lower than for the ‘off’ state in (D) due to a 15-fold lower loading rate.

