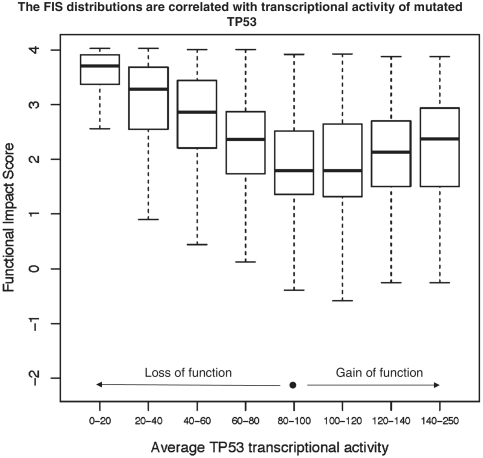
Figure 4.
FIS distributions of mutations in TP53 binned into eight classes based on mutational impact. The normalized transcriptional activities of 2314 TP53 mutants were averaged and, depending on the average activity value, the mutations were binned into eight classes; the ranges of the average transcriptional activity are given below the bin marks. The FIS distributions are presented by the box plots; thick black lines show the medians of the distributions; each of the boxes is drawn between the lower and upper quartiles of the distributions; the dotted lines extend to the minimum and maximum values of the distributions. The mutations with larger functional impact, i.e. higher or lower than normal transcriptional activity (‘loss of function’ or ‘gain of function’) tend to have the higher values of the FIS score.

