Figure 2.
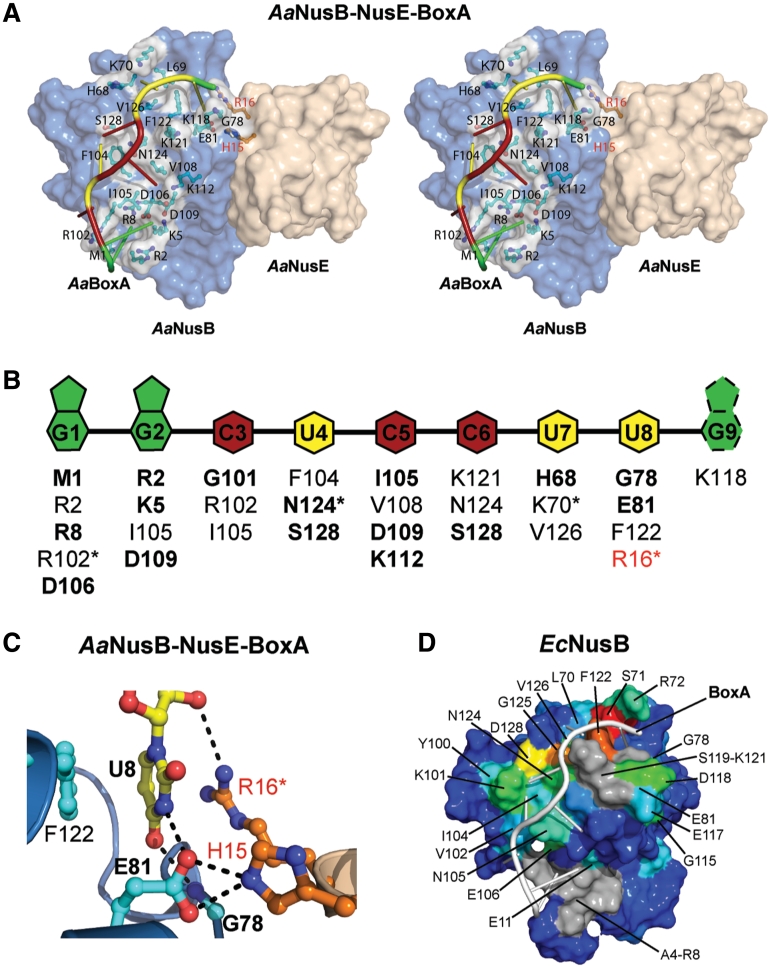
The BoxA binding site is highly sequence-specific. (A) Surface representation in stereo of the AaNusB–NusE–BoxA ternary complex illustrating all protein-BoxA interactions. AaNusB-contributing residues are shown in cyan and AaNusE residues in orange as ball-and-stick models. AaBoxA nucleotide bases are color-coded by base type according to the schematic in panel B. (B) Schematic of interactions between AaBoxA and AaNusB–NusE residues as observed in the crystal structure. Amino acid residues in bold are involved in nucleobase specificity. Asterisks denote residues interacting with 2′-OH groups of RNA. Residues labeled in red belong to AaNusE. The base of AaBoxA-G9 is shown with dotted lines to indicate that it is disordered. (C) Details of AaBoxA-U8 interactions with AaNusB–NusE at the heterodimer interface. (D) Surface representation of the chemical shift map of EcNusB upon binding of EcBoxA, presented on the solution structure of EcNusB (PDB ID: 1EY1) with EcBoxA (white) positioned as in the AaNusB–NusE–BoxA structure. The residues are colored according to the magnitude of Δδ (EcNusB subtracted from EcNusB–BoxA) ranging from ∼0 ppm (blue) to 1.2 ppm (red) (Supplementary Figure S3C). Differences between the chemical-shift-mapped EcBoxA binding site of EcNusB, relative to that observed in the Aa crystal structure, are primarily at the N-terminus. Residues A4-R8 (gray) are disordered in the free EcNusB protein and thus no Δδ could be calculated. However, the N-terminal resonances are observed in the EcNusB–BoxA complex, suggesting that this region is stabilized by interactions with EcBoxA. Similarly, exchange-broadened residues S119-K121, also for which no Δδ could be calculated, are shown in gray.

