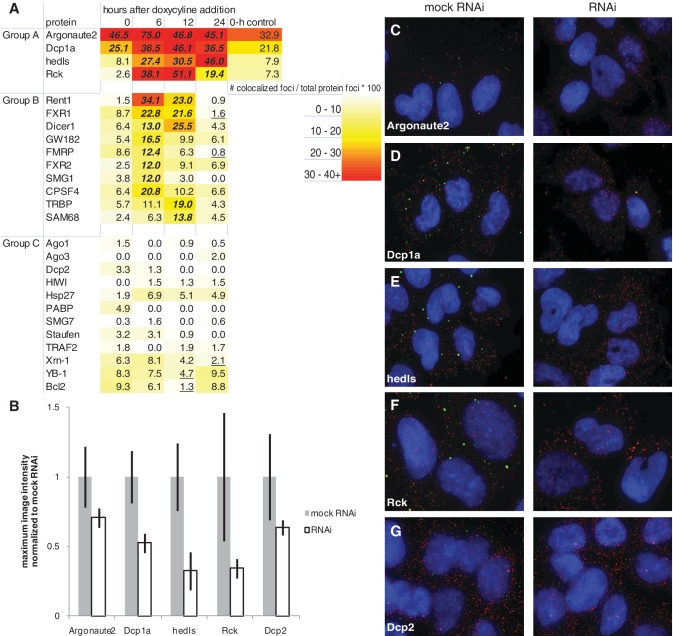
Figure 3.
P body and RISC proteins temporally co-localize with miRNA-regulated mRNA. (A) Heat map of protein temporal association with miRNA-regulated mRNA. Data points are taken 0, 6, 12 and 24 h after doxycyline induction of miRNA. Number of co-localized foci is divided by number of total protein foci to normalize for variable protein levels and get percentage of protein interacting with the target mRNA. Group A = proteins with high scores when miRNA is expressed. Group B = proteins with high scores in the first 6–12 h, presumably during active RNAi degradation of mRNA. Group C = proteins with low scores overall. Zero-hour control is the association score in a cell line with only the luciferase reporter to control for miRNA leakiness. Each data point is an aggregate of five images with ∼ 20 cells total. A statistical analysis was conducted comparing differences between population proportions of the 0-h time point to each other time point for each protein, except for Argonaute2 and Dcp1a which were compared to hedls at 0 h. Bold/italicized numbers indicate results significantly >0-h time point and underlined numbers indicate results significantly <0-h time point (P < 0.05). (B) The average maximum image intensity for each antibody either mock transfected (mock RNAi) or transfected with siRNA targeting the protein (RNAi). Data for each protein was normalized to mock RNAi. Error bars = standard deviation. N = 15. (C–G) Images of JDS33/48 cells either mock transfected (left) or transfected with siRNA (right) targeting (C) Argonaute2, (D) Dcp1a, (E) hedls, (F) Rck or (G) Dcp2. Cells were fixed 48 h after transfection and smFISH-IF co-staining of protein, the appropriate antibody (green, Cy-3) and luciferase reporter mRNA (red, Cy-5) was conducted. Blue = DAPI.

